

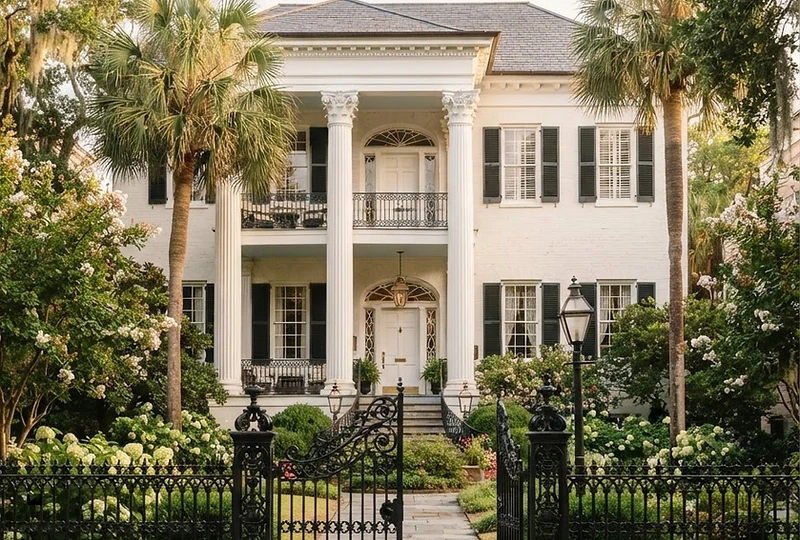
August 2026 · Charleston & Mount Pleasant
Monthly Briefing: August 2026
Median Price
$431.5K
Market Trend
Steady
THE BIG PICTURE
The Charleston region held a steady course in August. Buyer activity picked up, with pending sales up 11.8% year over year, while new listings eased slightly. Prices inched higher and homes took a little longer to sell, which points to a balanced market rather than a hot or cooling one.
REGIONAL INVENTORY (CHS MLS, ALL PROPERTY TYPES)
Active inventory
5,593 homes
Months supply
3.6 months
New listings
2,066
Pending sales
1,645
Closed sales
1,614
Median sales price
$431,500
Average sales price
$665,965
Days on market
51
Percent of original list price received
95.8%
Area by Area
daniel island
More homes changed hands this August, with single-family closings up 45.5%. The median eased from last August's unusually high mark, but year-to-date values are up 8.6%, and sellers received 96.2% of original list price.
Median sales price
$2,134,500
Average sales price
$2,431,631
New listings
20
Closed sales
16
Townhouse and condo median
$846,167
south mount pleasant
The standout of the month. Closed sales rose 18.2% to 65 and homes sold in 31 days on average, down from 40 last August. Values held firm.
Median sales price
$1,187,500
Average sales price
$1,547,375
New listings
70
north mount pleasant
A more measured month. Fewer homes came to market and prices adjusted, giving buyers more time to decide.
Median sales price
$935,000
Average sales price
$1,126,967
New listings
60
Closed sales
73
downtown charleston
Values continued to climb and homes sold considerably faster, averaging 45 days on market compared with 91 last August.
Median sales price
$2,442,500
Average sales price
$3,030,833
New listings
29
Closed sales
12
upper peninsula
Median sales price
$1,024,000
New listings
14
Closed sales
14
west ashley
Median sales price
$585,000
New listings
115
Closed sales
78


Mary's Take
What these numbers mean for you
If You're Buying
With 3.6 months of supply and sellers receiving about 96% of original list price, there is room to negotiate, especially in North Mount Pleasant where prices softened and homes are sitting longer. Well-priced homes in South Mount Pleasant and downtown are still moving quickly, so preparation matters there.
If You're Selling
Demand is healthy, as the jump in pending sales shows, but buyers are patient. Pricing correctly from day one and presenting the home well remain the difference between a 30-day sale and a 60-day one.
Mary E. Patterson, Broker Associate, 32 South Properties
Source: CHS Regional MLS / Charleston Trident Association of REALTORS (Monthly Indicators and Local Market Updates). Data deemed reliable but not guaranteed.